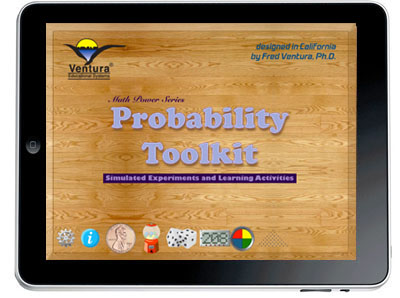
Math Power Series™
Simulated Experiments in Probability
The Probability Toolkit focuses learning on fundamental math concepts related to probability theory. Simulated experiments engage students in fascinating learning activities. The experiments are represented graphically and the results are shown using tables and graphs. The Common Core Standards for Mathematics recognizes the importants of emphasizing learning activities that deal with data analysis of chance events. This emphasis represents a departure from a mathematics curriculum that empahsizes memorization of facts. Today the role of data and chance in school mathematics is changing in terms of its importance and the extent to which these concepts relate to other subjects has been recognized. Modifications to the K-12 curriculum incorporate probability theory to a much greater extent.
People have a natural approach to understanding the role of data and chance in terms of everyday life. This informal understanding of probability theory becomes the basis for specific explorations which are designed to enhance this informal mathematical knowledge by helping students develop the ability to analyze chance situations presented through random experiments. The approach taken in the design of this app involves the implementation of instructional strategies that focus on these five themes:
Data Collection |
Students conduct experiments and make observations, then record the results in a tabular form. | |
Communication |
Through small group instructional approaches students learn to discuss mathematical concepts related to probability. Graphs, for example, are one way in which students learn how to describe chance events mathematically. | |
Problem Solving |
The role that understanding probability plays in enhancing problem solving skills cannot be over emphasized. Several investigations involve problem solvking using an understanding of probability theory to evaluate whether an answer is reasonable. | |
Logic and Reasoning |
Students (and adults) often make errors in reasoning when analyzing chance events. For example, many people would say erroneously that a coin toss is more likely to result in 'heads' after a series of events that resulted in 'tails' have occurred. | |
Connections |
The concepts involved in understanding probability, chance events and data analysis directly relate to many subject areas other than mathematics. Through the development of an understanding of the principles involved in probability theory students will have a greater ability to think critically about certain concepts in science, technology, engineering, social science, art and literature. |
Simulated Experiments in Probability:
 |
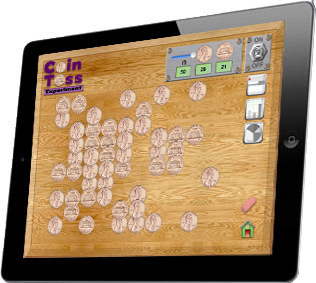
Coin Toss For each trial in the Coin Toss experiment students select the number of coins to be tossed on the iPad screen (1-50). The coins land with either the heads or tails side facing up. As the coins are tossed a table is built showing the results of each trial. A bar graph is used to compare the number of heads versus tails. The data can also be shown in a circle graph. Coins from the United States, Canada, Australia or Great Britain can be used in the experiment. The experiment shows a situation with two possible outcomes and each outcome has an equal probability. |
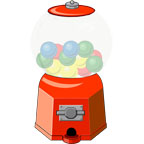 |
Gumball Machine |
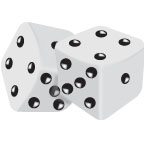 |
Dice Roll This experiment involves simulating the roll of a pair of dice. The roll of each die represents an independent event. The probability of getting a specific number when a pair of dice is rolled is determined by analyzing a table showing the number of times the specific number can occur considering all possible outcomes. Tables, bar graphs and circle graphs are used to communicate the results of the experiments. |
 |
Random Numbers The Random Numbers experiment lets students control the range of numbers from which random numbers are selected. Number theory and probability theory concepts are involved in this experiment because students are asked to determine the probability of getting an even, odd, prime, composite, square or palindrome based on the range setting. For example, if the range is numbers from 1-10, then the chances of getting an even number is 0.50 since one-half of the numbers in the range are even. Tables, bar graphs and circle graphs are used to communicate the results of the experiments. |
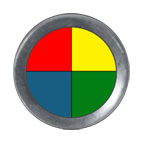 |
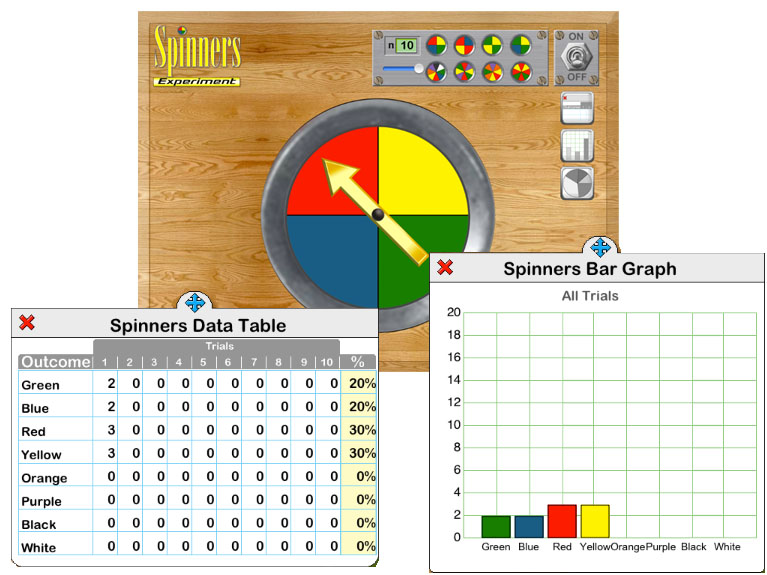
Spinners The Spinners experiment lets the students select one of eight different spinner. Each spinner represents different ratios of green, blue, red, yellow, orange, purple, black or white sections. By studying the spinners the students determine the theoretical probability of each color occurring. While running the experiments students will compare the theoretical probability to the actual outcomes. Tables, bar graphs and circle graphs are used to communicate the results of the experiments. |
| Binomial Machine Probability theory and statistics define the binomial distribution as a discrete probability distribution based on the number of successes in a sequence of n independent yes/no experiments. In this experiment a ball is dropped through a set of pegs that are placed in the shape of Pascal's Triangle. At each peg the ball has a 50/50 chance of falling to the right or left. A binomial distribution results and this important concept is the basis for the popular binomial test of statistical significance. |
Probability Toolkit
Developing a Fundamental Understanding of Probability Learning about probability can be fun for students. Probability plays a role in many of the games that students enjoy playing. Probability Toolkit goes beyond simple game playing and presents students with an interactive tool that encourages the developing of an understanding of probability theory and statistics. By controlling and observing simulated experiments involving different devices, students learn increasing the number of events and also summing events across trials improves the likelihood that an experimental probability will be close to a theoretical probability for a specific experiment.
|
The Probability Toolkit provides teachers and students with a collection of virtual mathematical devices to simulate probability experiments. The experiments involve use popular math manipulatives to help students better understand probability theory and statistics. It is perfect for elementary and middle school classrooms. Enrich your mathematics curriculum with the Probability Toolkit. Math educators have recognized the importance of emphasizing learning activities dealing with data and chance. This emphasis represents a departure from a mathematics curriculum that only emphasizes memorization of facts. Today the role of data and chance in school mathematics in changing in terms of it importance and also the extent to which these concepts relate to other subject areas. People have a natural approach to understanding the role of data and chance in terms of their everyday lives. This informal understanding becomes the basis for specific explorations which are designed to enhnace the mathematical ability of students to formally analyze situations involving probabilities. The approach taken in the design of this app involves the implementation of instructional strategies which focus on five basic themes:
We recommend that you open the Instructor's Guide PDF from your iPad in a new browser page and save the document in your iBooks app. |
Setting up Experiments, Building Tables and Interpreting Graphs
| Features: |
|
 |
$1.99 |
| Probability Toolkit The Probability Toolkit is a fun way to introduce probability theory and statistics. Using simple gestures students set the parameters for probability experiments, such as coin tosses. For this experiment students select the number of coins tossed for each trial. The results for each trial is reflected in a table. Data shown in the table can be represented as a bar graph or circle graph. Possible Topics:
|
|
|
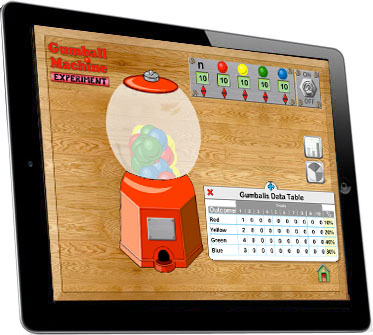
Tables and Graphs The results of probability experiments are represented in a tables and graphs. For example, in the Gumball Machine experiment, students set the ratio of each color of gumball. The initial set up is 10 red, 10 yellow, 10 green and 10 blue gumballs. Each ball has an equal probability of being randomly selected. As the experiment runs students will observe that experimental results do not always reflect the theoretical probability, however, increasing the number of gumballs in a trial or increasing the number of trials will bring the experimental results closer to the results predicted using probability theory.
|