Introduce Graphing and Data Analysis Concepts with this Interactive Tool

GraphPower provides teachers and parents with an educational tool for teaching data analysis and for developing skill in reading and interpreting graphs. Using GraphPower teachers will want to encourage students to build and analyze bar graphs, line graphs, circle graphs, and histograms. Active learning begins by entering the data for the graph, setting an appropriate scale, choosing colors and other featured in order to create a graph. Based on Common Core Standards, GraphPower gives kids the power to build and save graphs on their iPads. A complete curriculum provides teachers with lesson ideas and a variety of projects.
| Types of Graphs | Label Options | Statistical Topics: |
|
|
|
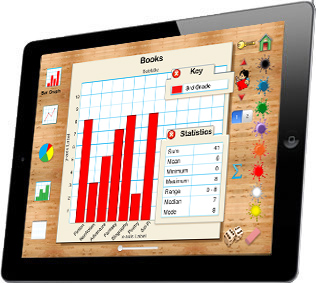
Fun Features: While using GraphPower students can scroll through a set of icons and then tap the icon to automatically set up a hypothetical graph. Next, tap the dice to generate random numbers for the graph and edit the graph with a titles and labels.
The GraphPower interactive learning environment is perfect for building skills and concepts related to data analysis. It is a useful classroom tool for core mathematics instruction and enrichment for teachers who want to strengthen graph reading and interpreting skills. While using this app students will do research and represent results of data collection appropriately in a bar graph, line graph, circle graph or histogram. The skills learned are relevant to the elementary mathematics curriculum. Encourage your students to use GraphPower to graphs to include in presentations for science or social science projects.
- Build graphs using data from surveys, as well as historical, political and scientific sources.
- Analyze and describe data presented in tables, or using bar graphs, line graphs, circle graphs and histograms.
- Learn statistical terms as mean, median, mode, minimum, maximum, and range.
- Summarize information and relationships revealed by a graph.
- Determine if a graph is appropriate for a particular situation.
- Add new data to a given chart, graph, or otherwise set of organized data.
- Extrapolate from obvious trends revealed by graphs in order to make predictions.
GraphPower provides simple interface to powerful tools to help kids learn how graphs are used for communication.Option to label the graph involve deciding on a title, subtitle, label for each axis. Tap icons to generate a graph. Younger learners will benefit from the optional auditory feedback that is provided as they manipulate the special graphing tools to design a graph.
Targeted Mathematical Development in the Following Areas:
Data Analysis |
Constructing Surveys, Collecting Data, Representing Data in a Graph, Reading a Graph Accurately, Using Graphs and Tables to Answer Questions | |
Number Sense |
Comparisions, (<, =, or >) | |
Statistics |
Mean, Median, Mode, Minimum, Maximum, & Range. | |
Logic and Reasoning |
Solving Logical Problems Using the Scientific Method, Deductive Reasoning |
Tap icons to automatically set up graphs projects in these areas:
| Sample Projects | ||
|
|
GraphPower
Collect Data and Create Graphs Based on Real-Life Situations We live in an Information Age. We are constantly bombarded with facts and figures about our complex world. The ability to read and interpret graphs is an increasingly important skill which helps us to make sense of confusing information in an effort to be better able to make decisions. Nationally, math educators have recognized that it is necessary to stress developing skill in graph interpretation as an essential part of the elementary and secondary curriculum in order to prepare students for full participation in adult society. The Curriculum and Evaluation Standards for School Mathematics, published by the National Council of Teachers of Mathematics call for increased emphasis on the use of graphing as a way to better interpret statistical data. Common Core Standards emphasize the importance of teaching graphing and data analysis skills. For students, learning to effectively use data is an important life skill. This type of learning is a critical component for effective participation in a democratic society. Graphs are used to communicate information and being able to read and interpret graphs is a key to understanding and decision-making. |
GraphPower turns your iPad into a power tool for teaching graphs and data analysis. Use GraphPower to create a graph to use in a presentation. GraphPower is perfect for elementary and middle school classrooms. Enrich your mathematics curriculum with the power of GraphPower! The ability to graph and interpret data is a critical skill. Everyday we encounter with graphs and tables designed to convey important information. Starting in the primary grades students are asked to evaluate, interpret, understand and discuss data that is presented in a table or graph. Tables and graphs are important not just in math class but in other areas as well. Graphs are used to present historical information, perhaps showing trends, or population. In science the results of an experiment is often presented using a graph or table. It is not hard to see why data analysis has become a major goal of the K-12 curriculum. GraphPower can help students develop data analysis skills. These skills must be learned early and reinforced often. Several important areas of the graphing and data analysis curriculum can be addressed using this app:
|
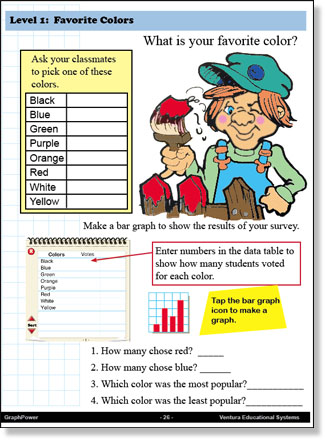 [ Sample Page ] [ Sample Page ] |
Instructor's Guide
We recommend that you open the Instructor's Guide PDF from your iPad in a new browser page and save the document in your iBooks app. The link above is for the complete 71 page manual. Note: The GraphPower manual is a large file. Depending on your internet connection you may need to download it in two sections. [ Instructor's Guide (PDF) Pages 1-36 ] [ Instructor's Guide (PDF) Pages 37-71 ]
|
Features
|
$2.99 |
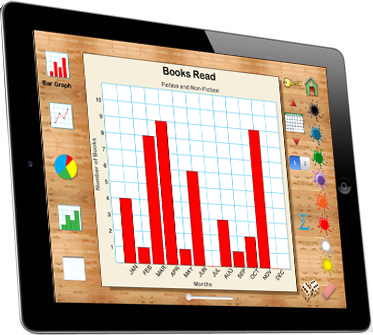
| GraphPower GraphPower is an effective way to introduce data analysis skills. Tap icons, enter data, and set the scale and labels to build a bar graph, line graph, circle graph or histogram. Student interaction with the graphing tools provides insight into how graphs are used to communicate information. Changes made to a data table are instantly reflected in the graph. Possible Topics:
|
|
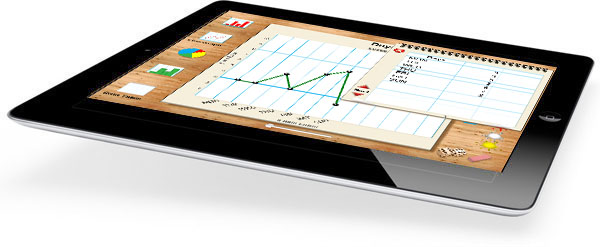
Fun Functions Tap icons to change from Bar Graph, to Line Graph, to Circle Graph or Histogram. Enter data into the Data Table.
|
|